
Most Amazon sellers waste months searching categories that are already saturated. They pick products based on gut feeling, launch them, and watch competitors outrank them within weeks.
The real money on Amazon sits in subcategories most sellers never bother to research. These are the gaps—places where demand exists, but the competitive wall is still thin enough to break through.
SmartScout Subcategories tool shows exactly where those gaps are. Using three core data points—review count, brand concentration, and revenue share—you can map out markets that are ready for a new player, not markets that are already drowning in inventory.
This guide walks you through the exact system to find these hidden subcategories, validate them with real data, and move before the crowd catches on.
What Makes a Subcategory “Underserved”?
Three metrics separate winners from time-wasters:
Low Brand Concentration
When 5–10 brands control 60% of a category, new sellers are boxed out. When 20+ brands share 60%, there’s room. SmartScout’s brand concentration filter shows you this instantly.
High Revenue, Low Competition
A subcategory with $5M monthly revenue sounds good—until you see 1,000 sellers fighting for it. A $2M subcategory with 150 sellers? That’s the target. Revenue per seller tells you margin potential.
Rising Review Counts Without Price Wars
When a category’s average review count is growing but price isn’t dropping, buyers are buying more, not harder. Spot the trend before it’s mainstream.
Apply code BLOGA25 at checkout & Get 25% Discount for first 3 months
Step 1: Open SmartScout and Navigate to Subcategories
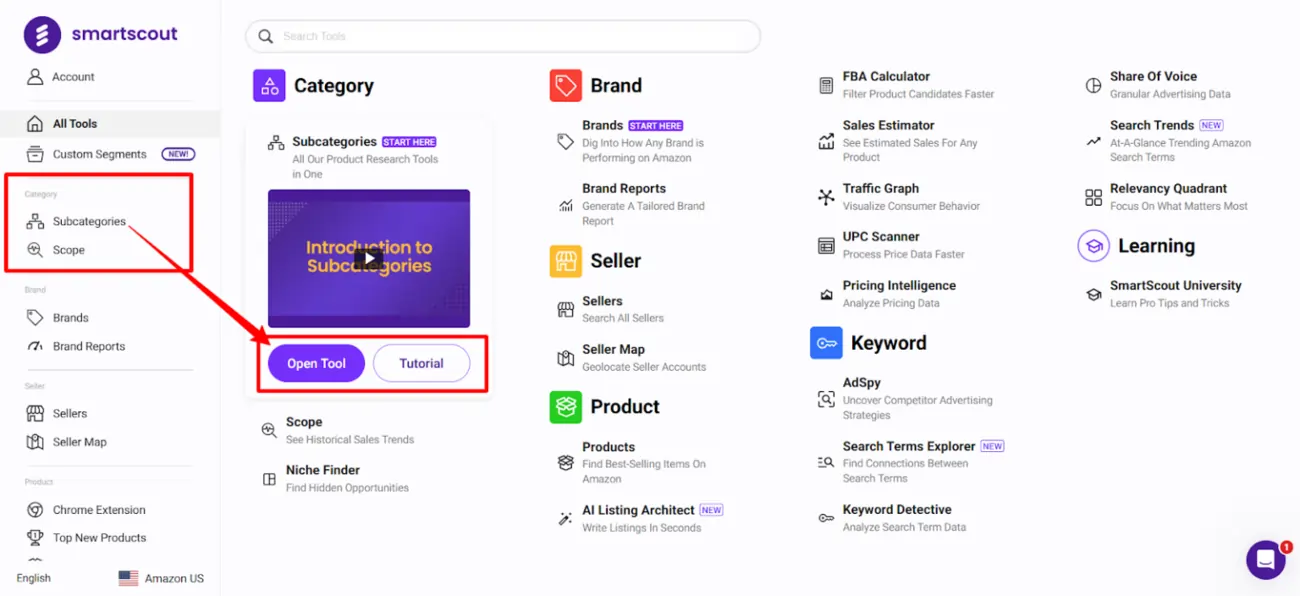
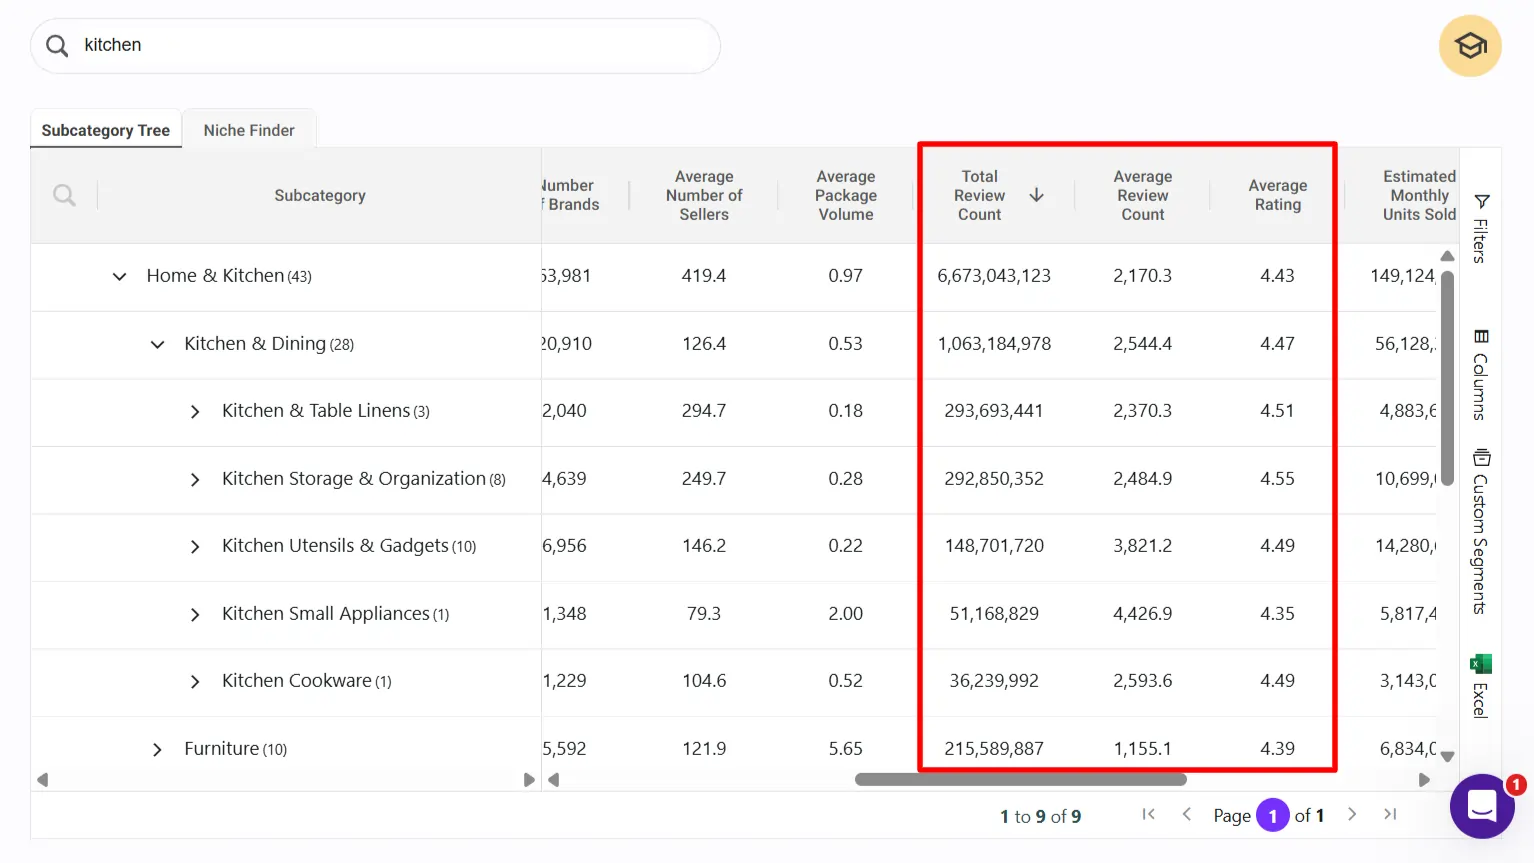
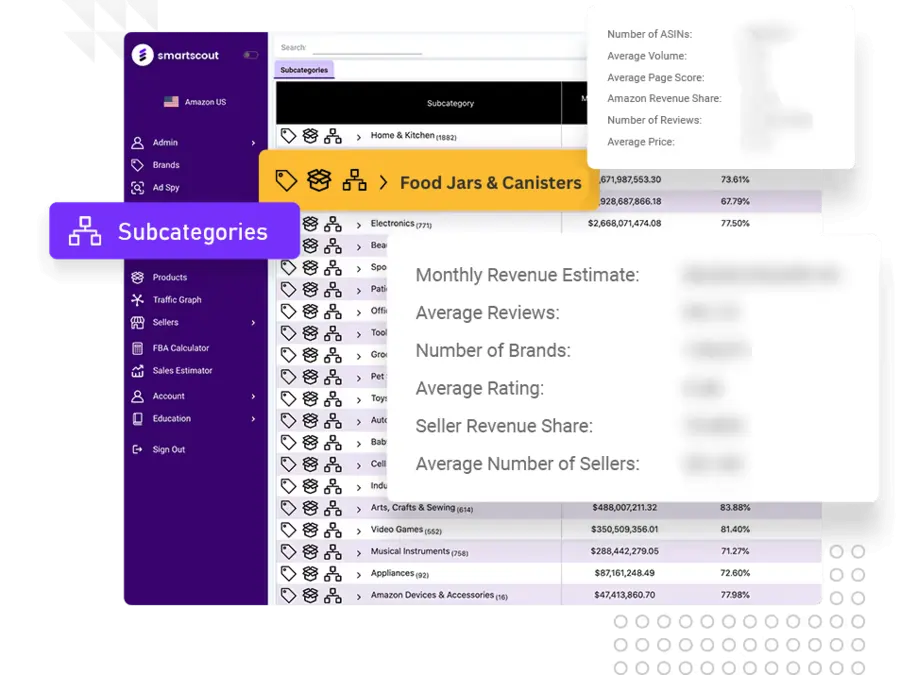
Log in to your SmartScout account. Click Subcategories in the main menu. You’ll see SmartScout’s full directory of Amazon’s category tree—over 40,000 subcategories organized by section.
Start with a main category you know. For this example, we’ll use Home & Kitchen.
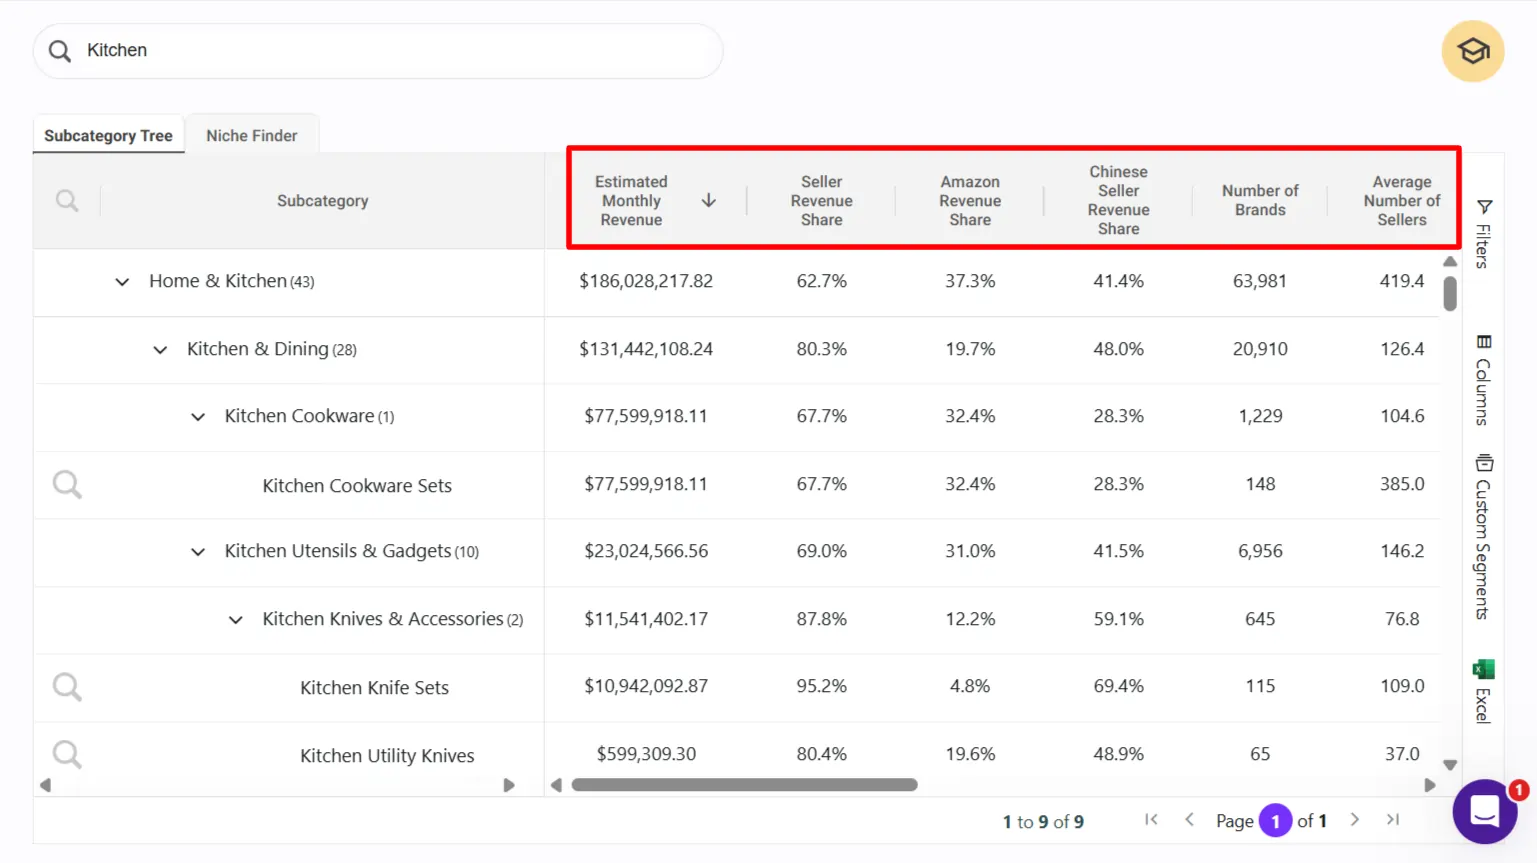
SmartScout displays baseline metrics for every subcategory:
These numbers are your first filter. Skim until you find subcategories that stand out as small but stable.
Step 2: Apply the Revenue-per-Seller Filter
Here’s where most sellers get it wrong. They look at total revenue and think “big category = more sales.” Wrong.
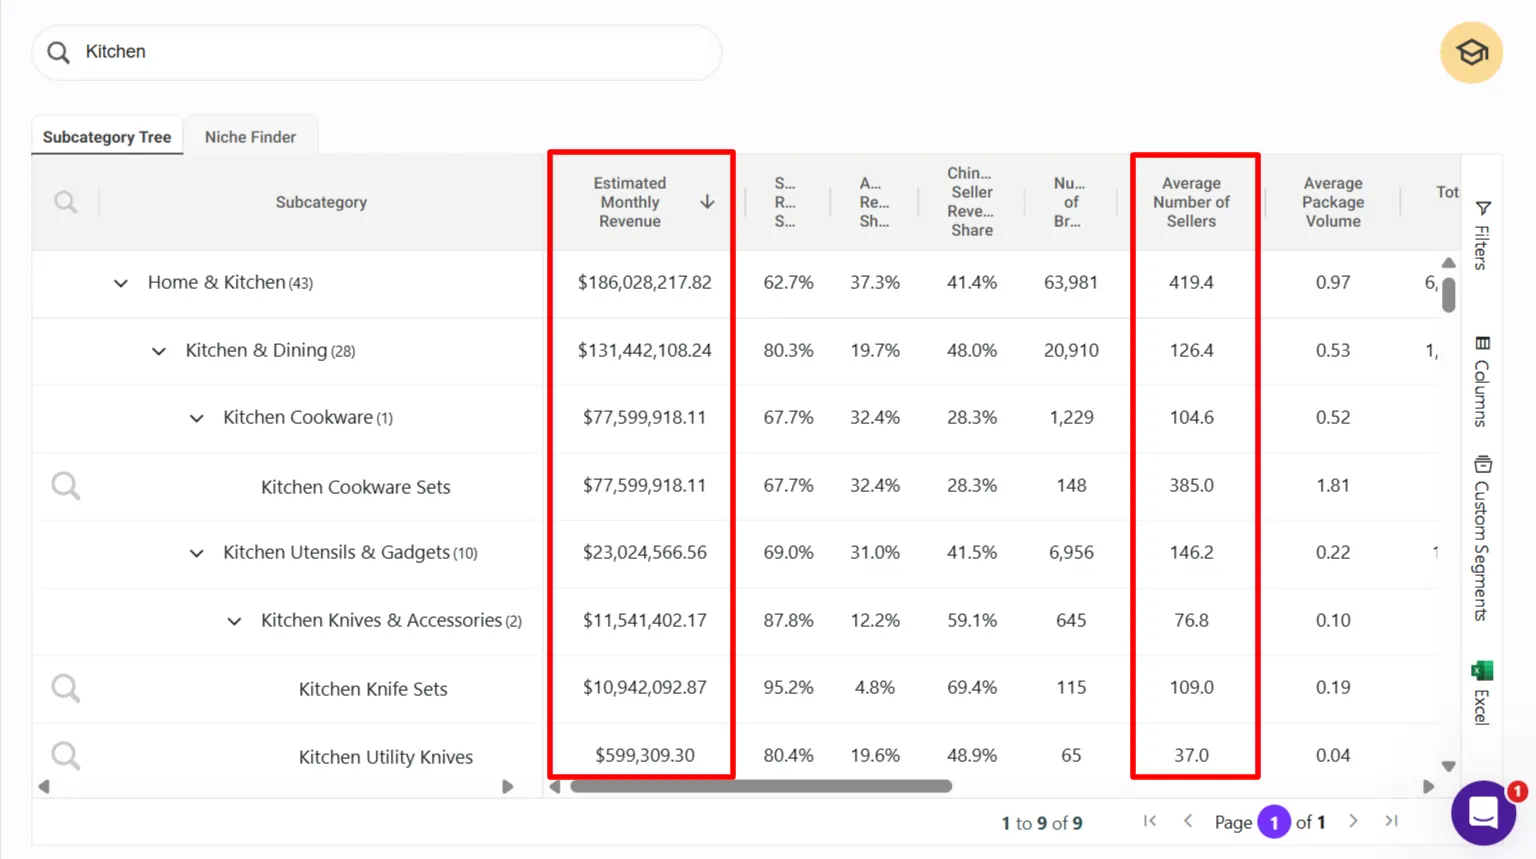
Divide monthly revenue by seller count. If a subcategory has $3M revenue and 300 sellers, each seller averages $10K/month. If a subcategory has $2M revenue and 100 sellers, each seller averages $20K/month.
The second one is the real prize—same market size, half the noise.
How to filter in SmartScout:
- Click any subcategory row
- Look at the “Revenue” and “Sellers” columns
- Mentally calculate revenue per seller
- Mark subcategories where revenue per seller is above your category’s median
💡 (Pro tip: SmartScout’s custom segments let you sort by these metrics side-by-side. Use that.)
Step 3: Check Brand Concentration for Market Entry Points
Click into a subcategory that passes your revenue-per-seller test. SmartScout opens a brand table for that subcategory.
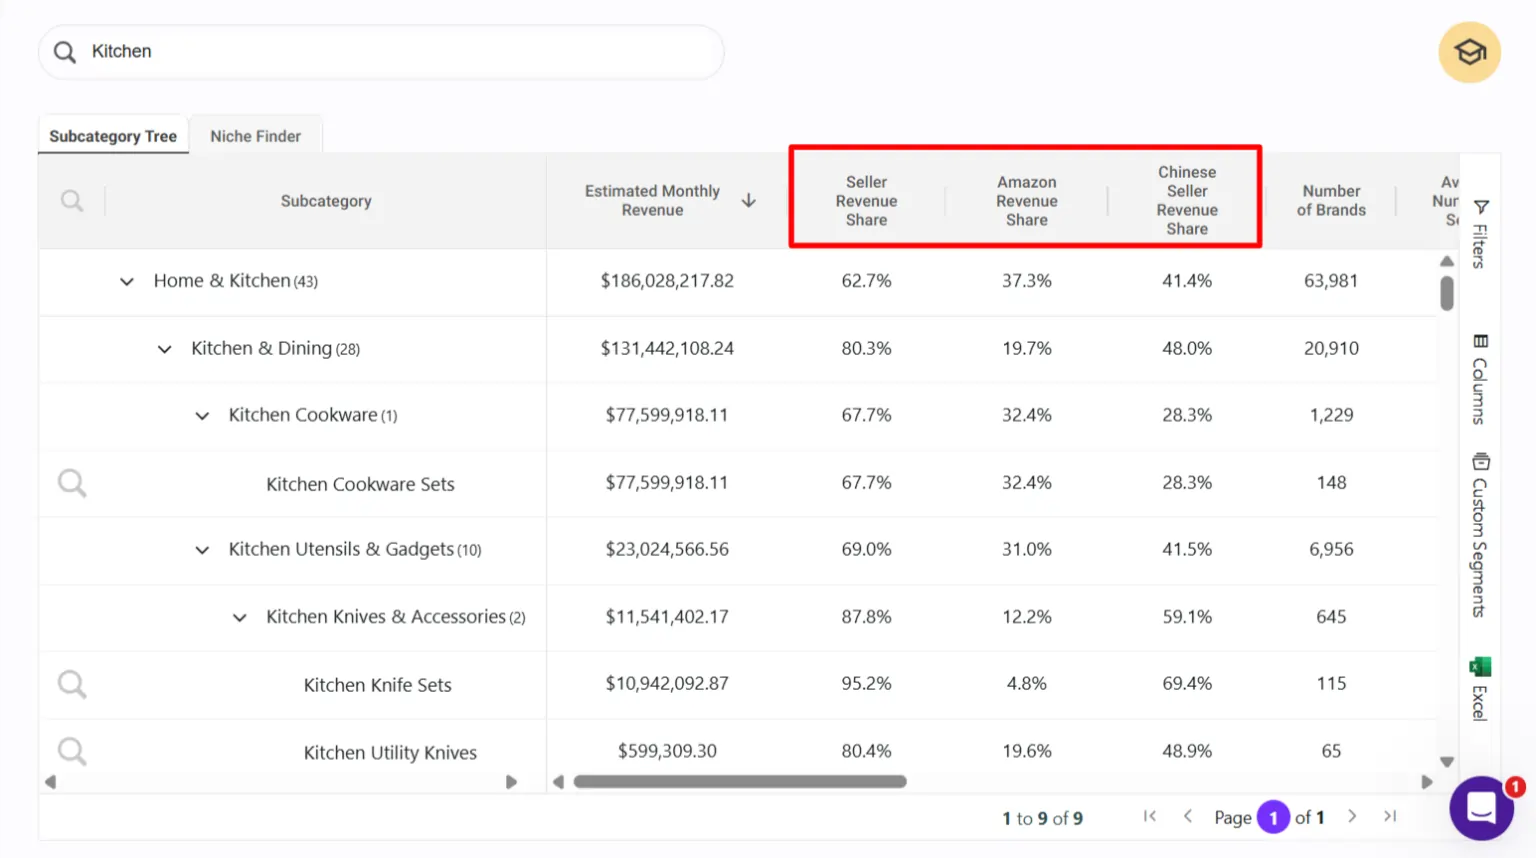
Look at the % Share column. This shows what percentage of the market each brand controls.
What you’re hunting for:
If the top 3 brands own 70% of the market, you’re entering a duopoly. The Buy Box is locked. Move on.
If the top 5 brands own 50% and there are 40 brands total, you’re in a fragmented market. Easier wins.
SmartScout shows you brand revenue share, number of ASINs per brand, and average sellers per brand. The brands with the most seller competition (high average seller count) often mean the brand has weak distribution—a sourcing opportunity.
Step 4: Analyze Review Count Trends (Demand Signal)
Switch to the Products tab within that subcategory. Sort by Review Count (highest first).
The top products in a healthy underserved market have:
If the top products have 10,000+ reviews, the market is mature. If they have under 50 reviews, demand is too thin.
💡 What you want: products with 800 reviews added over 18 months (not a flash-in-the-pan trend), solid ratings, and room for differentiation based on missing review keywords.
Step 5: Use SmartScout’s Niche Finder Filter for Speed
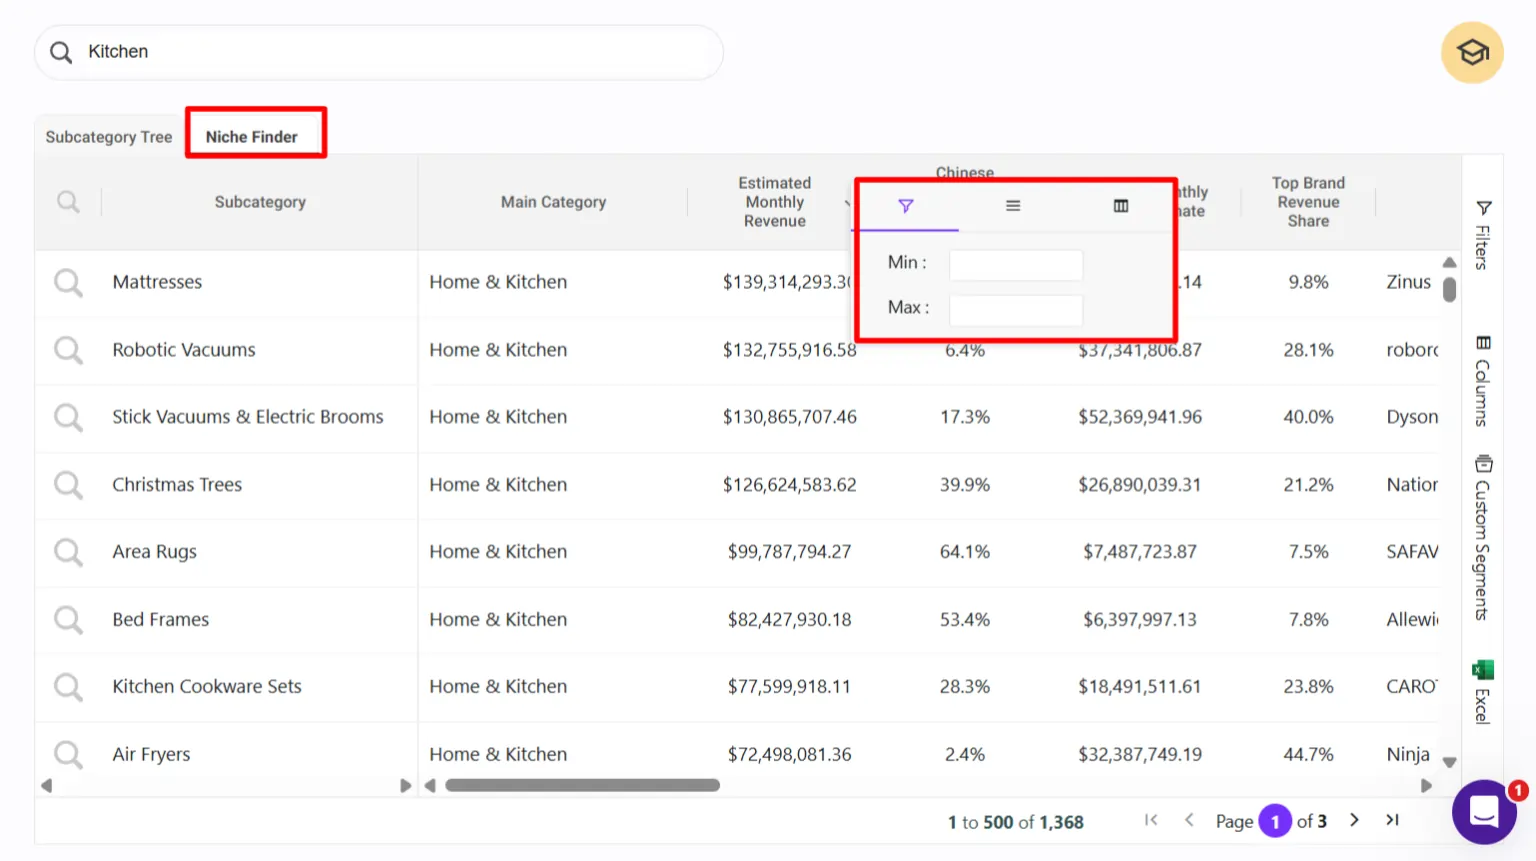
If manual browsing feels slow, SmartScout’s Niche Finder tab lets you stack filters at once:
Tick these boxes and hit apply. SmartScout returns all subcategories matching your criteria. Hundreds of options vanish. Dozens of real contenders surface.
This cuts your research time from hours to minutes.
Step 6: Reverse-Check with Revenue History (Scope)
Found a subcategory that looks promising? Cross-reference it with SmartScout’s Scope tool to see revenue trends over the last 12 months.
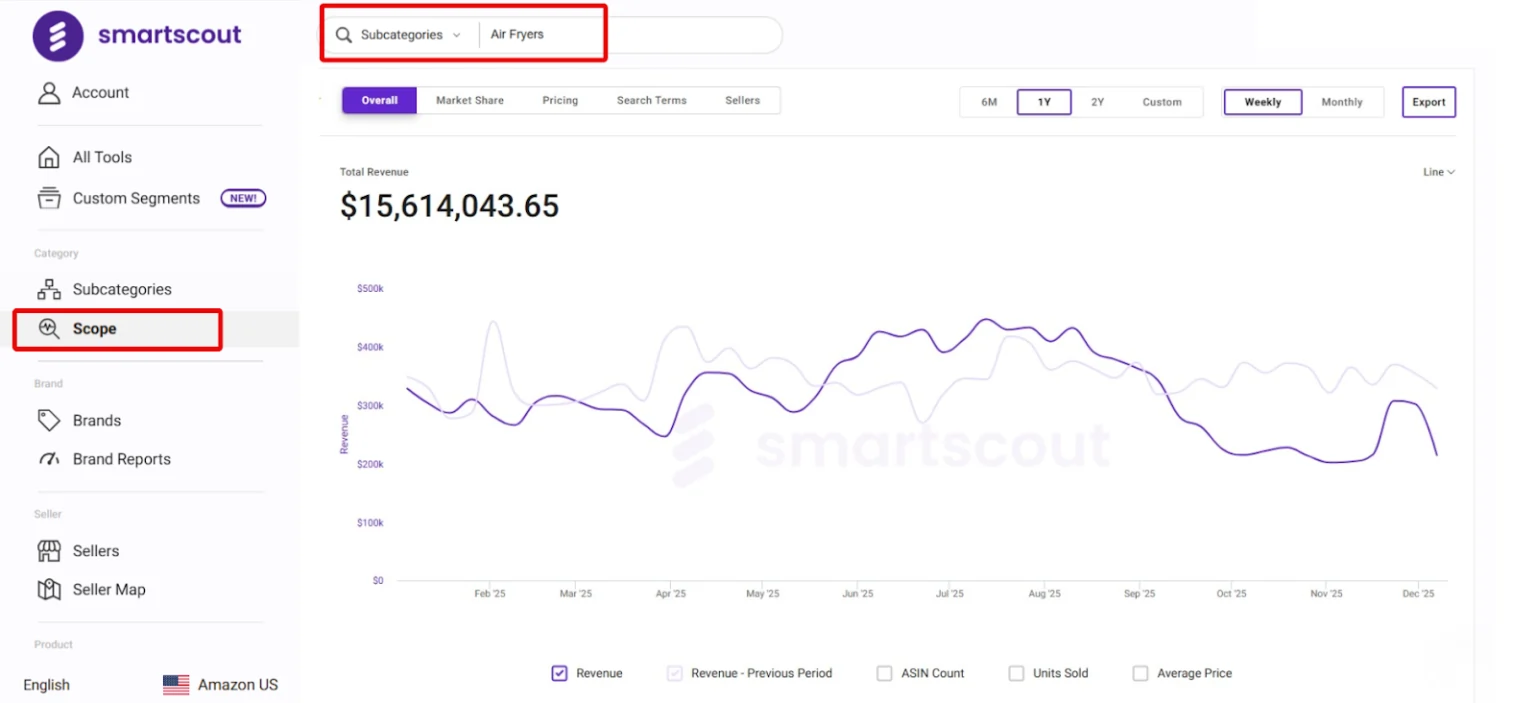
A subcategory that’s grown 15–30% year-over-year is entering growth phase. One that’s flat or declining is a trap.
Scope also shows you brand and seller revenue history. Spot which brands are scaling (good competitors to learn from) and which are fading (opportunities to capture their lost share).
Step 7: Map Competitive Listing Gaps
Within your target subcategory, use SmartScout’s Traffic Graph to see which products are connected (frequently bought together).
Then open the top 10 product listings. Look for:
These gaps = your entry angle. If every competitor has a weak listing, a strong one will rank faster and convert better.
Step 8: Set a Profit Threshold and Commit
Use SmartScout’s FBA Calculator to model your margin on a sample product in this subcategory.
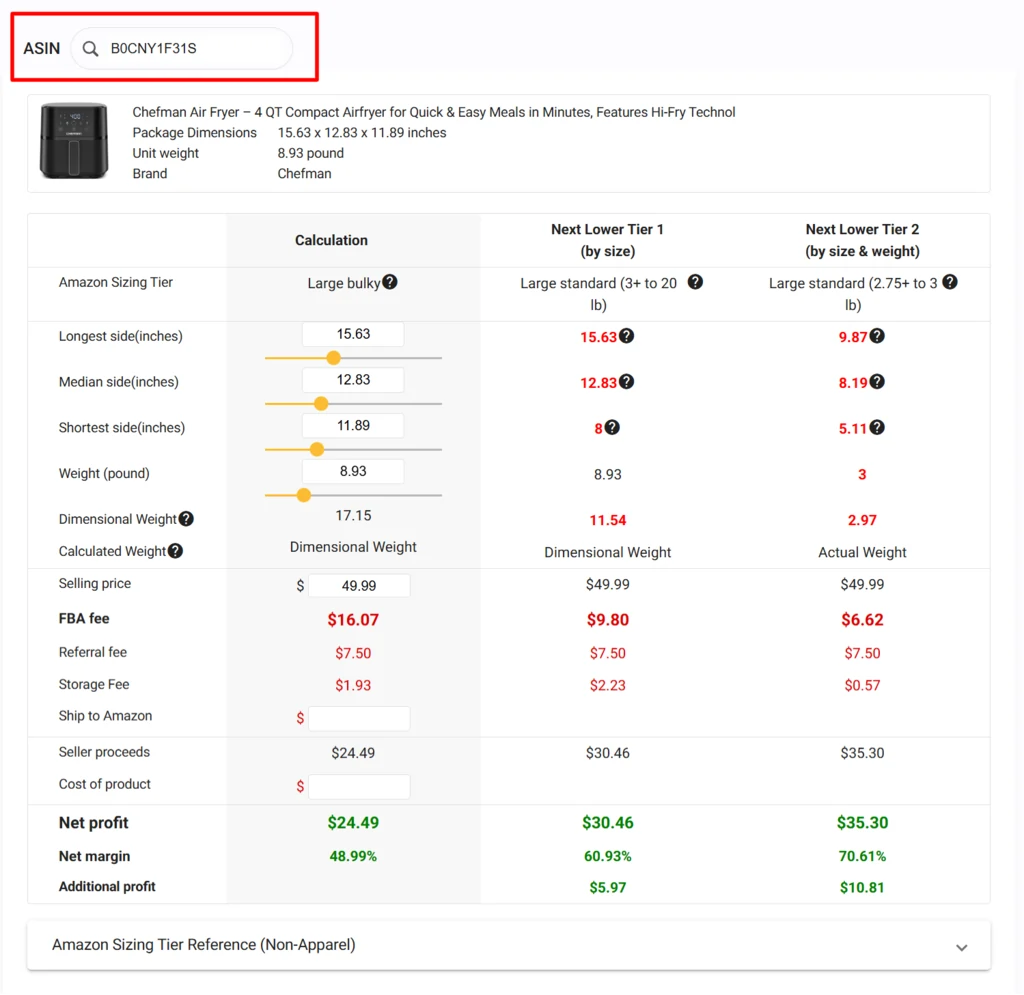
Plug in:
If your net margin is below 25%, pass. If it’s 30%+, move forward.
Real Example: Kitchenware Subcategory
This subcategory checks every box. It’s profitable per seller, fragmented, has steady demand (consistent review count growth), and isn’t dominated by Amazon’s own sales. New entrants have room.
The competitor analysis shows:
A seller entering with size variety and premium packaging could capture 5–10% market share within 6 months.
🚩 Red Flags: Subcategories to Avoid
💸 SmartScout Pricing & Exclusive Offer 💸
SmartScout’s plans start at $29/month (Basic) for hobby sellers up to $187/month (Business) for professional operations. Enterprise plans are custom.
The Subcategories tool, Scope, Traffic Graph, and FBA Calculator are included across all paid tiers.
Exclusive discount for blog readers:
- Use code BLOGA25 at checkout for 25% off your first 3 months on any SmartScout plan.
- That drops the Business plan from $187/mo to $140/mo. Annual commitment? Even steeper savings.
SmartScout Subcategories: What Sellers Ask Before Starting
How often does SmartScout update Subcategories data?
Daily. Revenue estimates, seller counts, and review data refresh automatically.
Can I use SmartScout Subcategories for wholesale sourcing?
Yes. Use the brand and seller filters to identify brands that sell through distribution channels (a wholesale signal).
What’s the minimum revenue a subcategory should have?
$500K–$1M monthly minimum to ensure enough liquidity. Anything below risks demand swings and inventory rot.
How do I know if a subcategory is growing or plateauing?
Compare month-over-month revenue and review count in Scope. 10%+ quarterly growth = healthy expansion. Flat or declining = stay away.
Can I export SmartScout Subcategories data?
Yes. Use SmartScout’s custom segments to build filtered lists, then export as CSV for further analysis in spreadsheets or your CRM.
Stop Guessing. Start Finding Real Amazon Opportunities
Underserved subcategories aren’t secret. They’re just invisible to sellers who don’t look for them.
Most competitors chase trending keywords instead of SmartScout‑level market structure. Most use intuition, not data. Most pick categories because they “sound interesting,” not because the math says they’re profitable.
The SmartScout Subcategories tool flips that. You search by profitability, you use real numbers, and you commit based on evidence.
The subcategories you find today are often the ones competitors will fight over six months from now. Move fast.
Affiliate Disclosure: This post may contain some affiliate links, which means we may receive a commission if you purchase something that we recommend at no additional cost for you (none whatsoever!)