
Your first Amazon private label product is succeeding. Sales are steady, reviews are climbing, and you’re finally profitable. Then comes the paralyzing question: what’s next?
Most sellers face this exact moment. The product research skills that identified one winning product don’t automatically translate to building an Amazon brand.
Launching a second SKU randomly often results in cannibalized sales or inventory mistakes. This isn’t a product problem—it’s a strategy problem.
Why One Success Doesn’t Guarantee Two?
Success with one product creates false confidence. Many sellers assume their playbook automatically works for expansion. It doesn’t.
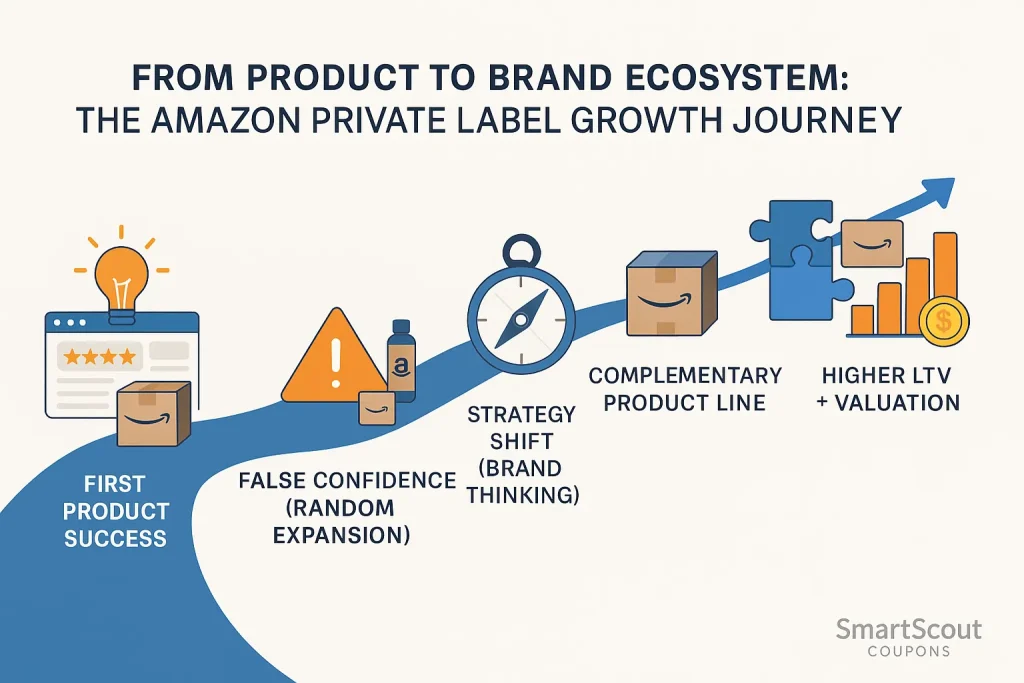
Your first product succeeded by filling a specific gap. Your second product must accomplish something different: strengthen your brand ecosystem. Research shows Amazon private label businesses with diversified product lines command 4x-6x profit multiples compared to 2.5x-3x for single-product operations.
The difference? Customer lifetime value. A customer buying yoga mats and yoga blocks has higher retention than one buying only mats. Brands that sell complementary products create defensible market positions that are worth more to acquirers.
From Product Hunter to Brand Architect
A product hunter searches for gaps—low competition, steady demand, margin potential. This works perfectly for finding your first SKU.
A brand architect thinks differently. She asks:

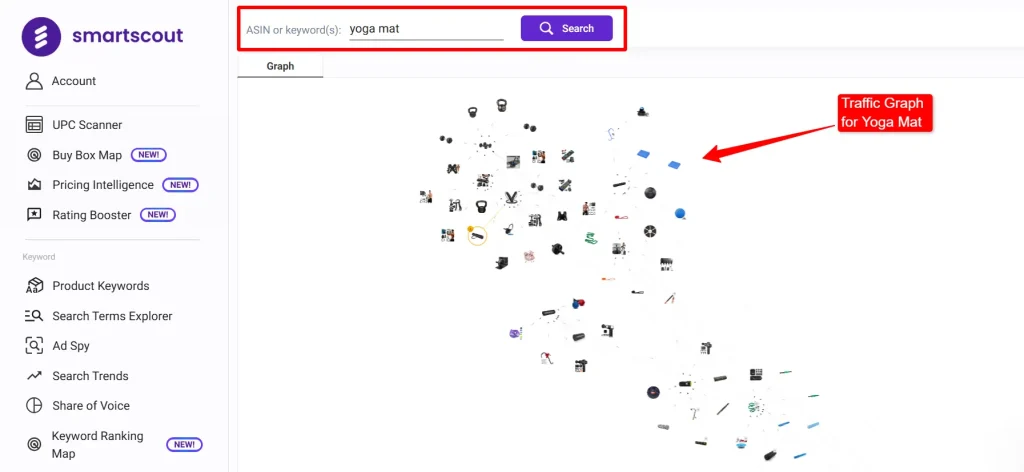
SmartScout’s Traffic Graph maps exactly this customer behavior, showing where traffic flows between products—revealing purchasing patterns from thousands of real transactions.
Amazon Private Label Expansion: Data-Driven Product Mapping
🤩 Step 1: Search Your Winning Product

Enter your best-performing ASIN into Traffic Graph. The tool instantly displays every product customers frequently purchase alongside yours.
🚦 Step 2: Analyze Traffic Strength
Products showing higher monthly traffic represent genuine customer behavior patterns. A yoga mat customer frequently buys yoga blocks, resistance bands, and water bottles—not speculation, but measurable data.
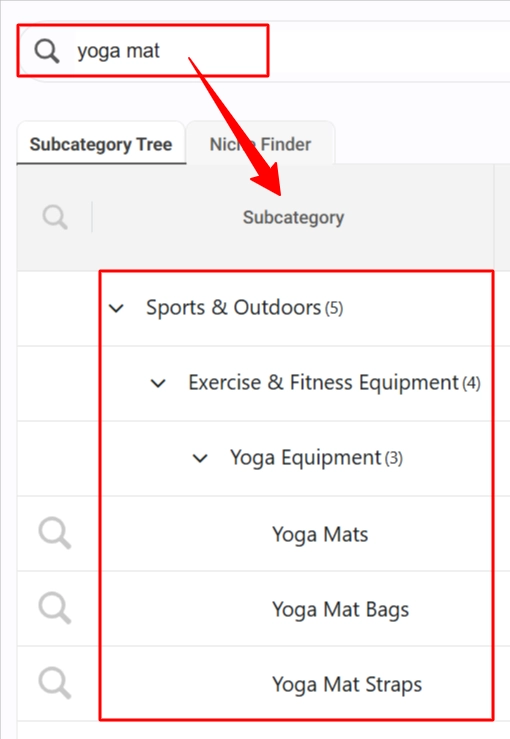
📦 Step 3: Filter by Category Relevance
Not every connected product makes strategic sense. Focus on products that extend your core category, not random items that dilute your brand.
🆕 Step 4: Cross-Reference Existing Inventory
Check if you already stock any recommended products. Sometimes opportunity involves repositioning current inventory rather than sourcing new items.
🔎 Step 5: Research Profitability
High traffic doesn’t guarantee margins. Pair Traffic Graph findings with competitive analysis to identify profitable extensions, not just high-traffic ones.
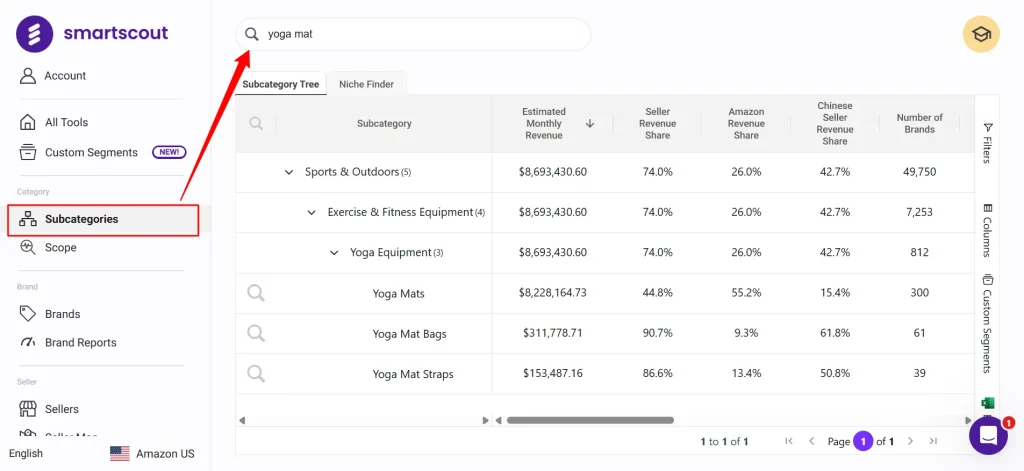
Using SmartScout Subcategory Analysis to Own Your Niche
While Traffic Graph reveals customer behavior, Subcategory Analysis exposes market structure.
Case Study: How “Yoga-Luxe” Built a Moat
Sarah launched a premium yoga mat in 2023—$12,000 monthly revenue within six months. Using Traffic Graph, she discovered:
Rather than random launches, Sarah used Subcategory Analysis to identify strategic gaps. She sourced premium blocks from her existing supplier and launched within 90 days. Blocks generated $7,500 monthly. Critically, customers buying both products showed 40% higher lifetime value.
Within 18 months, Yoga-Luxe offered five complementary products. Her gross revenue reached $39,700 monthly—but more importantly, her portfolio became acquisition-ready. Multi-product brands command 50-80% higher acquisition multiples than single-product businesses.
Why Data Beats Guesswork?
Traditional brand building involves guessing. When Traffic Graph shows that 60% of yoga mat customers buy yoga blocks within 30 days, that’s thousands of real transactions—not opinion.
This transforms how you operate. You’re more confident about inventory quantities. You can pre-negotiate ad placement on competitor products. You structure bundles that actually appeal to buyers.
The Moat Effect
A single-product brand is fragile. Algorithm changes or supply disruptions crater revenue overnight.
A diversified brand is resilient. When you own multiple positions—yoga mats, blocks, resistance bands—you become harder to displace. You occupy more search real estate, appear in more “frequently bought together” recommendations, and own more shelf space.
| Element | Single Product | Multi-Product Brand |
|---|---|---|
| Customer Lifetime Value | Standard baseline | 40-80% higher |
| Acquisition Valuation | 2.5x-3x net profit | 4x-6x net profit |
| Market Resilience | Vulnerable | Defensible |
| Cross-sell Opportunity | None | 35-60% overlap |
Building Your Brand Roadmap
The separation between $30,000-per-month and $100,000-per-month sellers isn’t product quality—it’s portfolio strategy. The former sells one excellent product to 3,000 customers. The latter sells five complementary products to those same customers, plus additional buyers attracted by portfolio depth.
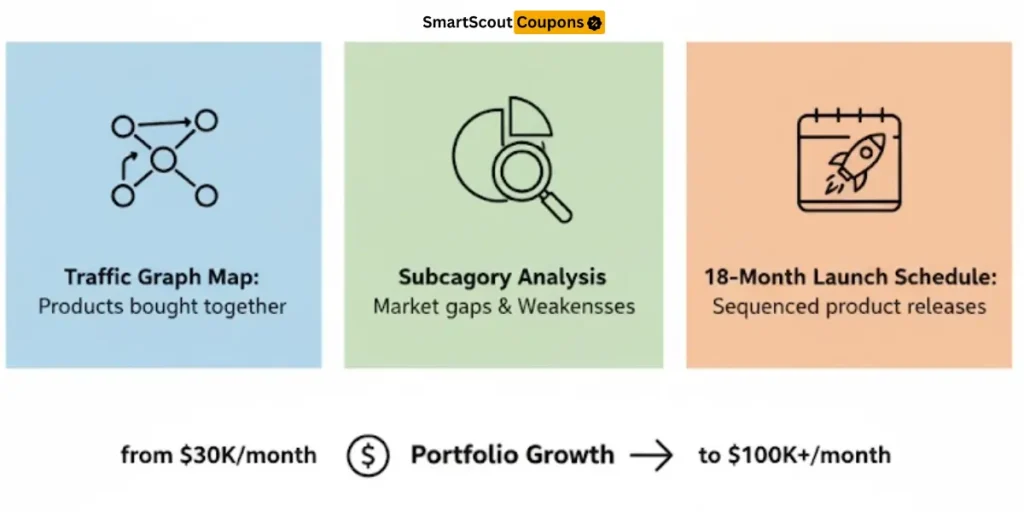
Document three things:
- Your Traffic Graph Map – Products customers frequently buy together
- Your Subcategory Analysis – Market gaps and competitive weaknesses
- Your 18-Month Launch Schedule – Sequenced product introductions
Creating Your Scalable Asset
When your business is a brand ecosystem, you’ve built a scalable asset. Acquirers aren’t just buying inventory; they’re acquiring customer data, market positioning, proven product extensions, and an expansion template.
The path between single-product operator and brand entrepreneur runs through data-driven tools and deliberate execution. Use Traffic Graph to reveal what customers actually buy. Use Subcategory Analysis to find strategic gaps. Execute your product roadmap.
That ecosystem becomes your asset—and ultimately, your exit.
Affiliate Disclosure: This post may contain some affiliate links, which means we may receive a commission if you purchase something that we recommend at no additional cost for you (none whatsoever!)